Biodiversity footprint at Sweco: What nature impacts does our business create – and how do we plan to reduce them?
Published: 19 March 2026
Sweco has calculated its own biodiversity footprint for the first time, making us a forerunner in the engineering, architecture and consulting sector. This biodiversity footprint result covers Sweco’s operations in Finland: purchased goods and services, business travel, employee commuting, energy use in offices, fuel use in vehicles and buildings, direct water consumption, and direct land use.
Biodiversity footprint calculation provides valuable information on how our operations affect nature and biodiversity, and helps us make data-driven decisions to reduce environmental impacts and the risk of biodiversity loss.
What does biodiversity footprint mean?
The biodiversity footprint describes the negative impacts that a company’s or organisation’s activities have on nature and biodiversity, based on, among other things, procurement, commuting and business travel, fuel, energy and water use, other own operations and location data. The biodiversity footprint complements carbon footprint calculations and provides a broader picture of an organisation’s environmental impacts.
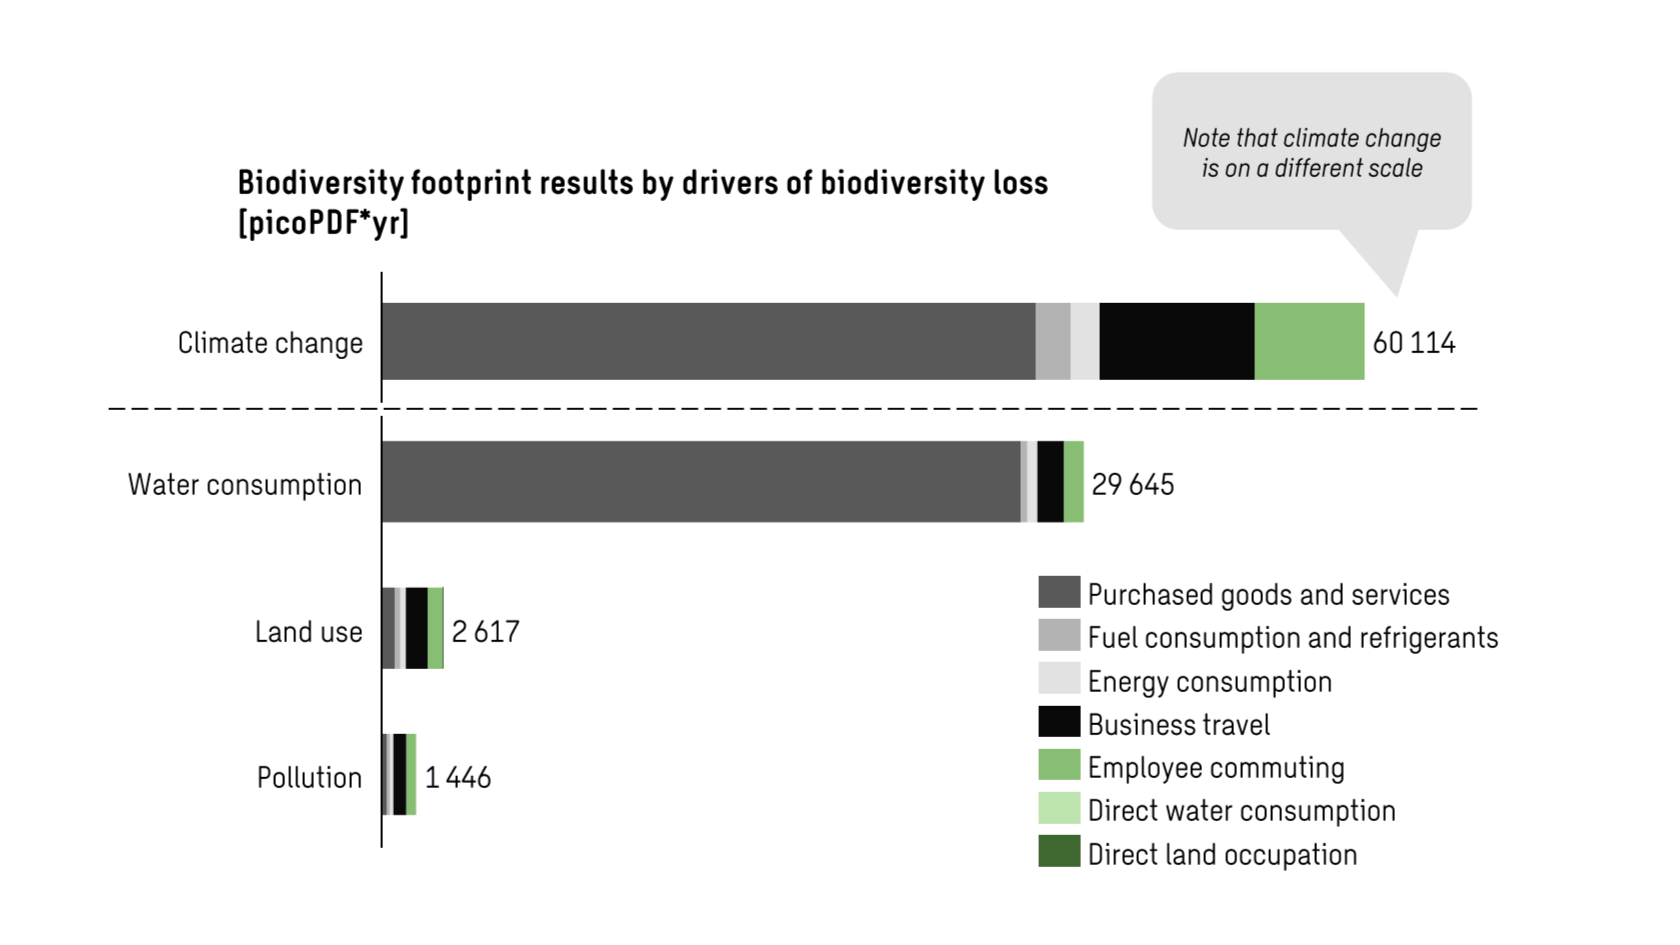
In biodiversity footprint calculations, different drivers of biodiversity loss are examined, such as climate change, land use, water consumption and pollution. The results can be viewed in relation to these different drivers, i.e. what share of the company’s or organisation’s biodiversity footprint is caused by each driver.
Sweco’s biodiversity footprint has been calculated using the PDF unit (PDF = Potentially Disappeared Fraction of species). The figure describes the percentage of global species that are at risk of extinction if operations continue as they are.
Summary: what does Sweco’s biodiversity footprint tell us?
Sweco’s biodiversity footprint is 9.4 × 10⁻⁸ PDF·yr (PDF = Potentially Disappeared Fraction of species), meaning that 0.0000094% of the world’s species are at risk through our operations.
The largest impacts arise from various procurements (72%), in particular IT software, which accounts for 54% of the total nature footprint.
Business travel and employee commuting account for 22% of the nature impacts.
Climate change accounts for 64% of the nature footprint and water consumption for 32%.
Sweco’s biodiversity footprint highlights the specific nature impacts of knowledge work – more important than the absolute figure is understanding where the impacts come from and how they can be reduced.
Methods are developing rapidly – and Sweco wants to be at the forefront of this development.
Biodiversity footprint data helps to target measures to reduce nature impacts effectively at the right points in a company’s operations. – Iida Vakkuri, Chief Sustainability Officer
What does biodiversity footprint consist of at Sweco?
Most of Sweco’s nature impacts are caused by climate change and water consumption
Most of the nature impacts from Sweco’s operations in Finland are caused by climate change (64%). After climate change, water consumption is the second-largest factor, accounting for 32% of the total impact. The importance of water consumption is particularly pronounced in the procurement of IT software.
Procurements – purchased goods and services: 72% of the total impact
The majority of nature impacts arise in the supply chain, and in knowledge work such as at Sweco, the nature impacts of IT software are emphasised. In total, 54% of Sweco’s biodiversity footprint comes from IT software. IT equipment is the second largest contributor to the procurement-related biodiversity footprint after software.
The most significant impacts of purchased goods and services occur in the United States, as Sweco uses many software products provided by US-based companies. Procuring IT software and services from countries with lower water stress related to water use would clearly reduce the biodiversity footprint.
In addition, procurement-related nature impacts especially target Finland, because we use many domestic service providers and purchase subcontracting from Finnish companies and companies operating in Finland.
Business travel and commuting: 13% and 9%
Travelling has a substantial impact on biodiversity footprint at Sweco, through climate change as well as land use and pollution. The use of diesel- and petrol-powered vehicles accounts for a significant share of the impacts of both business travel (93%) and employee commuting (84%).
Energy and fuel use: 3% and 3%
Purchased energy accounts for 3% of Sweco’s biodiversity footprint and consists almost entirely of electricity use. Another 3% of the biodiversity footprint comes from Sweco’s own vehicles and the refrigerants used in buildings, and in particular from emissions from the production and use of diesel.
What will Sweco do based on the biodiversity footprint results?
Biodiversity footprint calculation is not an end point, but a tool to guide Sweco’s next steps in improving the environmental responsibility. The biodiversity footprint helps us identify environmental impacts that are not visible in greenhouse gas emission reporting. The results strengthen our understanding of what, at Sweco and in similar knowledge-intensive companies, has the greatest effect on both climate change and biodiversity loss. Our current actions are in many ways the same as for reducing our greenhouse gas emissions:
Developing low-carbon procurement and introducing emissions reporting for subcontractors, which also reduces nature impacts
Extending leasing periods for IT equipment and mobile phones
A travel policy that favours train travel and reduces flying
Supporting sustainable commuting through employee benefits that can be used for public transport tickets
Monitoring results, especially as calculation methodologies evolve
Sweco also offers biodiversity footprint assessments to clients
Sweco’s biodiversity footprint reflects how knowledge-intensive work affects biodiversity. Our sustainability consulting experts offer biodiversity footprint calculation for our clients and help them identify the impacts of their own operations.
Biodiversity footprint assessment is attracting growing interest in many sectors, such as:
Ask us more about our biodiversity footprint and how it is calculated!
Iida Vakkuri
CSO
Piia Pessala
Strategic planning
Leave us a message!
Manage Cookie Consent
We use cookies to optimize our website and our services. For our policies, please visit our cookie policy.
Functional
Always active
The technical storage or access is strictly necessary for the legitimate purpose of enabling the use of a specific service explicitly requested by the subscriber or user, or for the sole purpose of carrying out the transmission of a communication over an electronic communications network.
Preferences
The technical storage or access is necessary for the legitimate purpose of storing preferences that are not requested by the subscriber or user.
Statistics
The technical storage or access that is used exclusively for statistical purposes.The technical storage or access that is used exclusively for anonymous statistical purposes. Without a subpoena, voluntary compliance on the part of your Internet Service Provider, or additional records from a third party, information stored or retrieved for this purpose alone cannot usually be used to identify you.
Marketing
The technical storage or access is required to create user profiles to send advertising, or to track the user on a website or across several websites for similar marketing purposes.