
Biodiversity footprint calculation – YIT’s pilot project in Helsinki
YIT carried out project-specific biodiversity footprint calculation for the Hermanninranta project in Helsinki
Together with Sweco’s sustainability consultants, YIT carried out a project-specific biodiversity footprint calculation for the Hermanninranta school, daycare, and youth facility project in Helsinki in the summer of 2026. The pilot’s goal was to identify the project’s most significant impacts on nature and gather experiences for utilizing the method in future projects.
The project in brief: Biodiversity footprint calculation of the Hermanninranta school, daycare, and youth facility project
Client: YIT
Services included in the assignment: project-specific biodiversity footprint calculation; in addition, Sweco has carried out the project’s carbon footprint calculation and been responsible for its structural and building services engineering
Execution year: 2026
Location: Hermanninranta, Helsinki
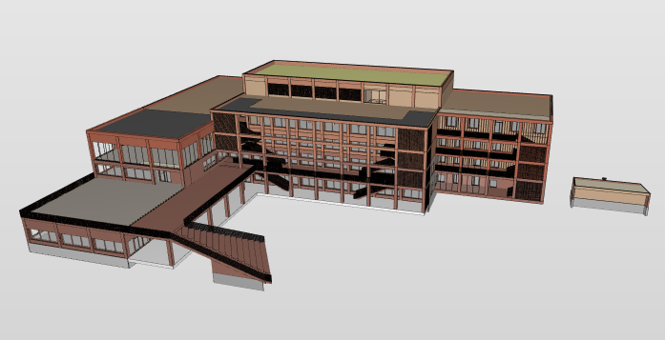
Gross floor area: 11,000 m². A four-story building, with the fifth floor reserved for technical facilities
The facility will serve approximately 700 pupils, 224 daycare children, and about 160 staff members, as well as roughly 150 youths in the youth facilities. Estimated completion in 2029.
Biodiversity footprint calculation complemented the construction project’s sustainability review
YIT and eQ Social Infrastructure Fund are constructing the Hermanninranta school, daycare, and youth facility project for the City of Helsinki in the new Hermanninranta residential area. Several sustainability targets have been taken into account in the design and implementation of the project.
“The city already set carbon footprint targets for the construction in the request for tenders, and the design and implementation of the project aim to meet the EU taxonomy requirements for buildings,” says Timo Kuorikoski, Site Manager, public construction, YIT.
Taxonomy requirements have been considered, for example, in the project’s carbon footprint calculation, building services design, and energy efficiency. Practical examples include the use of low-emission energy and recycling construction waste. Targets were also set for energy and material efficiency as well as the yard’s green factor. “In addition, we at YIT are aiming for four stars in the Finnish Rakennustieto Environmental Classification.” The Rakennustieto Environmental Classification is Finland’s national sustainability certification system for buildings, managed by the Building Information Foundation RTS.
Sweco had previously carried out a carbon footprint calculation for the project, which meant a large part of the material and baseline data needed for the biodiversity footprint calculation was already available.
“Starting the biodiversity footprint calculation was smooth, as we were able to focus immediately on analyzing the project’s biodiversity impacts and reviewing the results,” says Sweco’s Senior Consultant and the project manager for the biodiversity footprint project, Sanna Uolamo-Uusitalo.
According to YIT’s Project Engineer Joni Haapaharju, the collaboration was straightforward. “The calculation progressed according to a clear process, and information flowed well within Sweco.”
Sweco also acted as the project’s structural and building services designer.
Biodiversity footprint calculation delivers the greatest value during procurement
In this project, the biodiversity footprint calculation was carried out in connection with the building permit phase. During the pilot, however, it was identified that the opportunities to influence the calculation are greatest in the earlier phases.
“The calculation supports decision-making the most when it is utilized already in the procurement and design phase,” Kuorikoski notes. The earlier nature impacts are examined, the more the results can guide material choices and design solutions. “Then the calculation would already influence the content of contract bids and steer decision-making and design in the same way as carbon calculation.”
The biodiversity footprint calculation focused on the impacts caused by the manufacturing of construction materials. The biodiversity of the building site and the local nature impacts of the plot were excluded. Since Hermanninranta is primarily a wooden building, the impacts of different material and structural solutions on the biodiversity footprint could be examined in the project.
“Sensitivity analyses for alternative frame and intermediate floor solutions were also made in the calculation,” Uolamo-Uusitalo says. “Through comparisons, we were able to roughly estimate how different material choices affect the result and which solutions generate the most significant impacts.”
The most significant biodiversity impacts were caused by three material groups
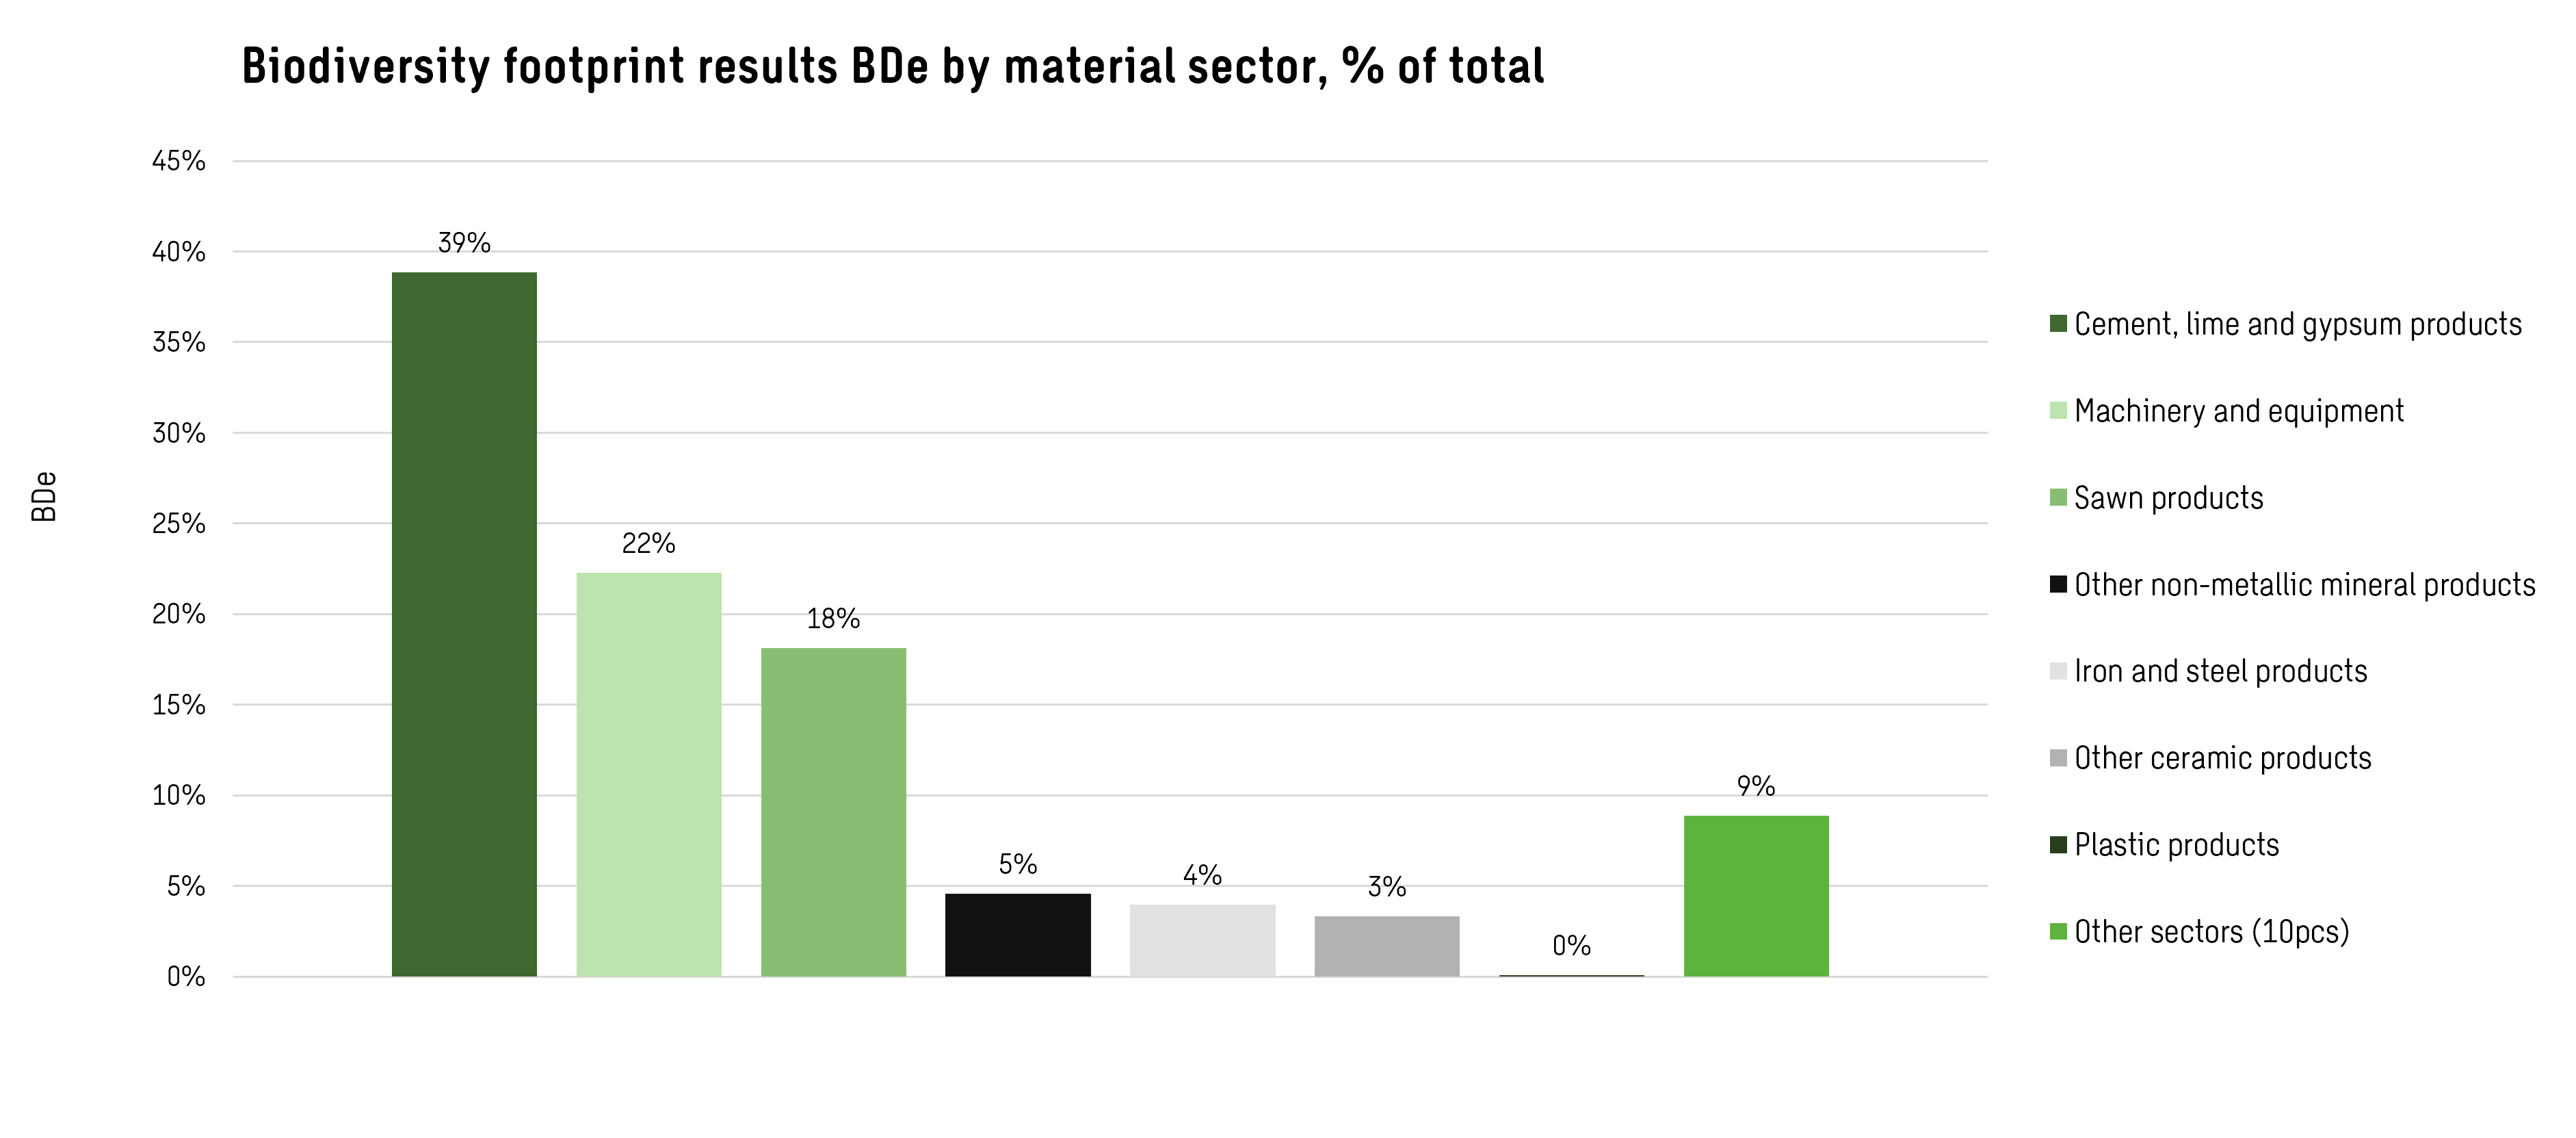
In the biodiversity footprint calculation, the different construction materials were divided into material groups, of which the three largest accounted for about 79 percent of the biodiversity footprint of the project’s materials. The greatest impacts came from cement, lime, and gypsum products, machinery and equipment, and sawn timber products.
“The results also showed that the vast majority of the project’s biodiversity impacts were caused as a result of climate change,” Uolamo-Uusitalo adds. The share of climate change in the total biodiversity footprint was 79 percent. “The results confirmed the perception that it pays to examine climate and nature impacts side by side. Many solutions that reduce the carbon footprint also support the reduction of biodiversity impacts.”
Land use formed the second most significant impact category with a share of about 15 percent. The share of sawn timber products was particularly emphasized due to land use impacts. “Because of forestry land use, the biodiversity footprint of wood materials is surprisingly large,” Kuorikoski says.
From a carbon footprint perspective, however, wood-based materials often appear to be better solutions than steel- and concrete-based materials. “That is why impacts should be viewed as a whole and not through a single metric,” Uolamo-Uusitalo concludes.
Biodiversity impacts are created in global value chains
The pilot revealed that the biodiversity impacts of construction materials largely occur in global value chains.
“The biodiversity footprint calculation helped us understand that material impacts are not limited to the construction site or even to one country,” Haapaharju says. “Although we procure construction products mainly from Finland, the biodiversity impact of the global value chains of construction materials extends around the world through goods deliveries.”
Experiences from the pilot for future projects
The most important takeaway from the Hermanninranta biodiversity footprint calculation pilot was the practical experience of carrying out a biodiversity footprint calculation in a construction project. In addition, the pilot provided more understanding of what kinds of choices affect the final result the most.

Ways to take biodiversity impacts into account:
- Using low-carbon solutions, such as low-carbon concrete products.
- Targeting development measures at materials that have intensive nature impacts, are purchased in large euro amounts, or make up a large part of the biodiversity footprint.
- Optimising structural and material choices in the design phase, e.g., alternative comparisons of frame solutions.
- Guiding procurement by taking into account the impacts of the entire production and value chain.
Interested in biodiversity footprint calculation? Contact us!

Piia Pessala
Strategic planning